Grade Curve Calculator
Adjust student scores using different curving methods to reflect relative class performance
How it works: The calculator applies your selected curving method to adjust scores. Linear adds points to make the highest score 100%, Ratio multiplies all scores proportionally, Bell Curve redistributes using statistics, and Square Root emphasizes lower scores.
Enter scores and click Calculate Curve to see results
Rate this Tool
How useful was this calculator for you?
Related Other Calculators
Explore these related calculation tools
A grade curve calculator helps teachers and students assign letter grades fairly by using statistical methods such as the bell curve or fixed percentage distributions. Using input values like the mean, standard deviation, highest, and lowest scores, it distributes grades according to a curve so that the majority of students receive average grades (C), while fewer students get high (A, B) or low (D, F) grades.
A grade curve calculator, also known as a grading curve calculator, grading bell curve calculator, or curve grading calculator, is a tool designed to assign letter grades based on student performance relative to the rest of the class.
Unlike absolute grading, which assigns grades strictly based on raw scores, grading on a curve adjusts grades so that the distribution reflects typical performance patterns, often a bell-shaped curve.
Entities:
- Bell Curve – statistical model for normal distribution
- Mean (μ) – average score of the class
- Standard Deviation (σ) – measures score dispersion
Using a grading on a curve calculator helps educators and students by:
- Normalizing grades for difficult exams
- Ensuring fairness when tests are unusually easy or hard
- Identifying top and bottom performers
- Reducing mass failures in challenging courses
For students, it clarifies their standing in the class relative to peers. For teachers, it simplifies the complex calculations of grade distribution.
1. Bell Curve (Normal Distribution)
The bell curve grade calculator is the most statistically accurate method. It distributes grades based on mean and standard deviation, assigning grades according to how far scores deviate from the class average.
Typical Percentile Distribution:
| Grade | Percentile Range | Z-Score Approximation |
|---|---|---|
| A | Top 2% | z ≥ +2.05 |
| B | 84–98% | +1 ≤ z < +2 |
| C | 16–84% | −1 ≤ z < +1 |
| D | 2–16% | −2 ≤ z < −1 |
| F | Bottom 2% | z ≤ −2.05 |
Key Features:
- Input: Total students, mean (μ), standard deviation (σ)
- Output: Letter grades, percentile ranges, approximate z-scores
2. Fixed Range / Classic Curve
The grade curve calculator based on average or fixed approximation method uses the highest and lowest scores to create grade bands. This is less precise but faster when mean and standard deviation are unknown.
Default Percentage Bands:
| Grade | % of Students | Description |
|---|---|---|
| A | 2% | Top performers |
| B | 14% | Above average |
| C | 68% | Average students |
| D | 14% | Below average |
| F | 2% | Lowest performers |
Whether using a grading curve calculator online or an offline tool, the workflow is similar:
Inputs Needed:
- Total Test Population (N)
- Mean Score (μ) – for bell curve
- Standard Deviation (σ) – for bell curve
- Highest and Lowest Score – for fixed range method
Grade Assignment Formula:
For Bell Curve:
z = (x − μ) / σ
Assign grades based on z-score ranges.
For Fixed Range:
- Compute score range: Highest Score − Lowest Score
- Split scores into percentage bands
- Assign grades according to bands
Suppose a physics test has 100 students, mean 30, and standard deviation 8. Using a bell curve grade calculator with mean and standard deviation, grades are assigned as:
| Grade | % of Students | Number of Students | Score Range |
|---|---|---|---|
| A | 2% | 2 | ≥ 46 |
| B | 14% | 14 | 38–46 |
| C | 68% | 68 | 22–38 |
| D | 14% | 14 | 14–22 |
| F | 2% | 2 | ≤ 14 |
Highest score: 50, Lowest score: 10, Total students: 100
| Grade | % of Students | Number of Students | Score Range |
|---|---|---|---|
| A | 2% | 2 | 49.2–50 |
| B | 14% | 14 | 43.6–49.2 |
| C | 68% | 68 | 16.4–43.6 |
| D | 14% | 14 | 10.8–16.4 |
| F | 2% | 2 | 10–10.8 |
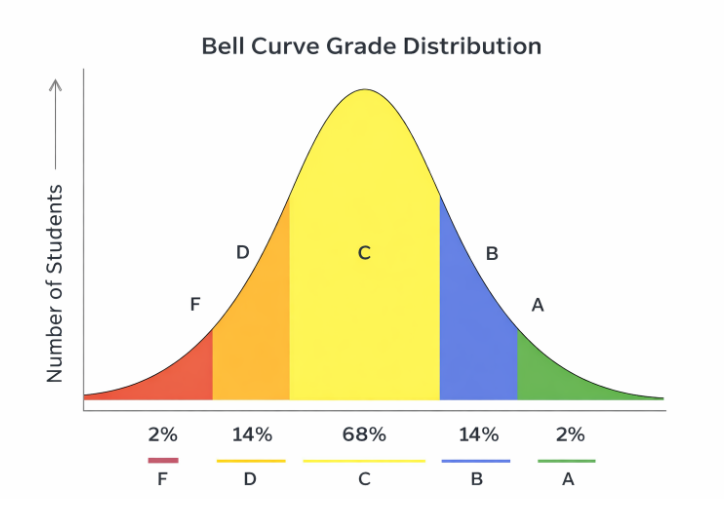
Visual representation of bell curve grade distribution showing typical percentile ranges
Pros:
- •Fair distribution in difficult exams
- •Recognizes top performers
- •Reduces mass failures
- •Provides motivational structure
Cons:
- •Top performers may feel penalized
- •Lack of transparency for students with same grade
- •Encourages competition over collaboration
Q1: What is the difference between absolute grading and grade curving?
Absolute grading assigns grades based on fixed score thresholds. Curve grading adjusts grades relative to class performance.
Q2: Can I use a grade curve calculator for small classes?
It's less effective for small classes (<10 students) because statistical patterns may not be meaningful.
Q3: Is grade curving fair?
Fairness depends on the test context. It's fair in challenging exams but may penalize top performers in easier tests.
Q4: What is the formula for curving grades?
For bell curve: z = (x - μ)/σ. For fixed range, divide score range into percentage bands and assign grades accordingly.
Q5: Are there online tools for curve grading?
Yes, a grading curve calculator online can compute both bell curve and fixed range distributions instantly.
A grade curve calculator is an essential tool for educators and students to understand, visualize, and assign grades fairly. Using either a bell curve grade calculator or fixed approximation method, it ensures grades reflect student performance accurately and provides insights into class performance.
Whether you need a grade calculator with curve, grading on a bell curve calculator, or bell curve grade distribution, using a calculator simplifies grading, ensures fairness, and saves time.