Empirical Rule Calculator
Calculate data ranges using the 68-95-99.7 rule for normal distributions. Find percentages within 1, 2, or 3 standard deviations from the mean.
📊68% Range (±1σ)
~68%About 68% of the data falls within ±1 standard deviation from the mean.
📈95% Range (±2σ)
~95%Around 95% of the data is within ±2 standard deviations from the mean.
🎯99.7% Range (±3σ)
~99.7%Roughly 99.7% of the data lies within ±3 standard deviations from the mean.
The Empirical Rule Calculator (also called the 68-95-99.7 rule calculator) is a statistics tool that helps you find ranges of values in a normal distribution where specific percentages of the data lie.
It's based on the Empirical Rule — a statistical rule that applies to normally (bell-shaped) distributed data.
📈 What the Empirical Rule Says
For a dataset that follows a normal distribution:
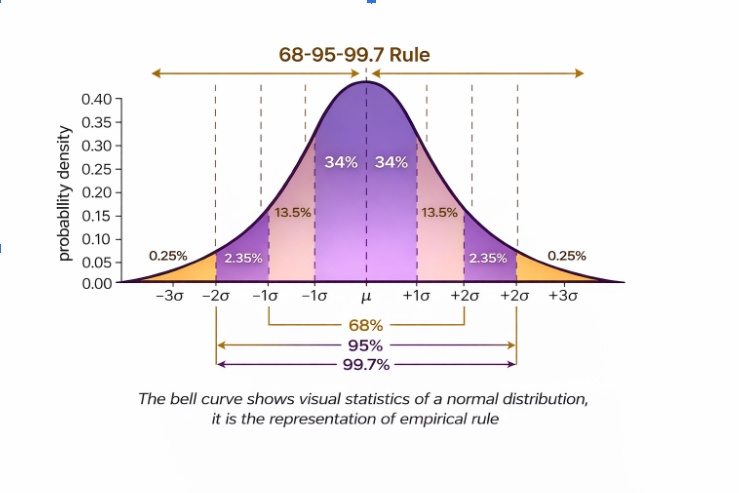
- ✔About 68% of the data falls within ±1 standard deviation from the mean.
- ✔Around 95% of the data is within ±2 standard deviations.
- ✔And roughly 99.7% of the data lies within ±3 standard deviations.
This is why it's often called the 68-95-99.7 rule or three-sigma rule.
Step-by-Step: How the Calculator Works
1️⃣ Input Required
You enter: Mean (μ) — the average of the data, and Standard Deviation (σ) — how spread out the data is around the mean. These numbers must come from your dataset or calculation. The calculator doesn't take raw data values; it needs the computed mean and standard deviation.
2️⃣ Mathematical Formulas Used
Once you enter the mean and standard deviation, the calculator applies these formulas:
68% range:
Lower bound = μ - σ, Upper bound = μ + σ
About ~68% of values fall between these two numbers.
95% range:
μ - 2σ to μ + 2σ
About ~95% of values lie here.
99.7% range:
μ - 3σ to μ + 3σ
Roughly ~99.7% of the data lies between these bounds.
Key Concepts Behind the Calculator
📌 Mean (μ)
The mean is the average of your dataset:
μ = sum of all values / number of values
This tells you where the center of your data is.
📌 Standard Deviation (σ)
The standard deviation measures how much the data varies around the mean. A large σ means the data is spread out; a small σ means it's more tightly clustered.
σ = √[Σ(xi - μ)² / (n - 1)]
Where: xi = each data value, n = number of data points
📌 What Each Range Means
| Range | Formula | Approx. % of Data |
|---|---|---|
| ±1σ | µ - σ to µ + σ | ~68% |
| ±2σ | µ - 2σ to µ + 2σ | ~95% |
| ±3σ | µ - 3σ to µ + 3σ | ~99.7% |
This means that in a normal distribution: Most data is near the mean, Very few values are far away from the mean, Values beyond ±3σ are extremely rare.
📍 Example
If scores are normally distributed with:
Mean μ = 100
Standard deviation σ = 15
Then:
- ~68% are between 85 and 115,
- ~95% between 70 and 130,
- ~99.7% between 55 and 145.
📌 Where the Empirical Rule Is Used
This rule is often used for:
- ✔Identifying how data is spread
- ✔Estimating probabilities quickly
- ✔Detecting outliers (values outside ±3σ)
- ✔Checking whether data roughly follows a normal distribution
What is an Empirical Rule Calculator?
An Empirical Rule Calculator is a statistical tool used to determine the percentage of data that falls within 1, 2, or 3 standard deviations of the mean in a normal distribution. It saves time, reduces errors, and is widely used by students, teachers, and data analysts.
The empirical rule (68-95-99.7 rule) states: ~68% of data lies within 1 standard deviation of the mean, ~95% of data lies within 2 standard deviations of the mean, and ~99.7% of data lies within 3 standard deviations of the mean. This rule applies specifically to normally distributed data.
Who Uses an Empirical Rule Calculator?
- •Students learning statistics
- •Teachers preparing classroom examples
- •Data analysts working with normal distributions
- •Researchers and business professionals
How to Use an Empirical Rule Calculator
Input the Mean and Standard Deviation
Provide your dataset's average (mean) and standard deviation.
Choose the Range or Values
Select whether you want percentages for:
- ±1 standard deviation
- ±2 standard deviations
- ±3 standard deviations
- Or between two specific numbers
Calculate Percentages
The calculator applies the empirical rule formula to output results.
Interpret the Results
Percentages indicate how much data falls within the specified ranges—useful for probability analysis, decision-making, or classroom demonstrations.
Tips:
- Use a step-by-step calculator to understand each calculation.
- Try a calculator with graphs to visualize the bell curve alongside percentages.
- Include example calculations for ±1, ±2, ±3 SD to help beginners.
Examples of Using an Empirical Rule Calculator
- •Normal Distribution Calculator: Check what fraction of students scored within a range in an exam
- •Standard Deviation Calculator: Analyze sales data to see typical variations
- •Empirical Rule Probability Calculator: Estimate likelihood of a value falling within a certain range
- •Percentage Calculator with Mean & SD: Teach students statistics visually
Advantages of Using an Empirical Rule Calculator
- ✓Time-saving: Eliminates manual calculation
- ✓Accurate: Reduces human error
- ✓Educational: Great for teaching and learning
- ✓Versatile: Works in Excel, TI-84, or online tools
- ✓Visualization: Some calculators include graphs of the normal distribution
Platforms & Tools
- •Online Empirical Rule Calculators: Work directly with datasets in your browser
- •Excel Formulas: Automate calculations for large datasets
- •TI-84 Calculator Programs: Built-in or downloadable options
- •Graph-based Calculators: Visualize bell-shaped distributions along with percentages
FAQs
What is an empirical rule calculator?
A tool to calculate percentages of data within 1, 2, or 3 standard deviations in a normal distribution.
How do you calculate manually?
Use these percentages:
- ±1 SD → ~68%
- ±2 SD → ~95%
- ±3 SD → ~99.7%
Can I use it in Excel or TI-84?
Yes. Excel formulas or TI-84 built-in programs can calculate percentages quickly.
How to interpret results?
Percentages show how much data lies within a chosen range, useful for probability and data analysis.
Is it useful for professionals?
Yes. Widely used in analytics, research, finance, and business for quick insights.
How do I calculate empirical rule between two numbers?
Enter the numbers as a custom range in calculators that support 'between two values' functionality.
How do I calculate using TI-84 or Excel?
Use built-in programs on TI-84 or formulas in Excel referencing the mean and standard deviation.
Rate this Tool
How useful was this calculator for you?
Related Math Calculators
Explore these related calculation tools